Hunted: How to Place Stop-Losses That Don't Get Swept Before the Real Move
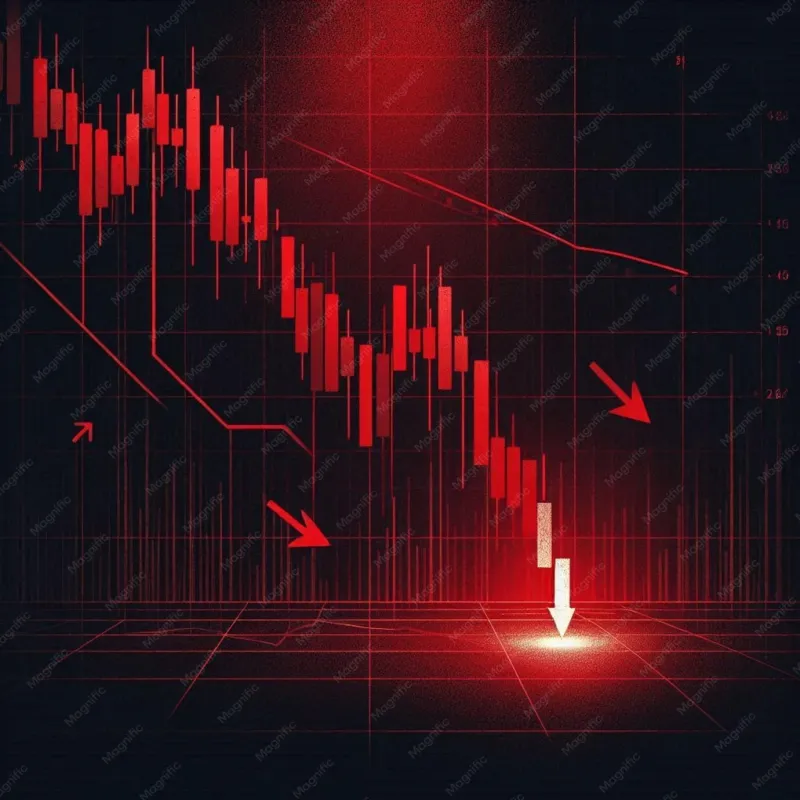
Photo: candlestick chart sharp wick downward spike trading screen, via img.freepik.com
Every trader has lived this scene: you buy a breakout, set a tidy stop-loss a few percent below your entry, go to make a sandwich, and come back to find you were wicked out at the exact low of the day — right before price ripped back through your original entry and kept going.
That's not a coincidence, and it's not bad luck. It's mechanics. And once you understand the mechanics, you can place stops that survive the noise.
Why Your Stop Is a Beacon, Not a Shield
Retail stop-losses cluster like geese. Everyone sees the same support level, everyone puts their stop 'just below it,' and everyone picks the same round number — $59,000 instead of $58,740, $2.90 instead of $2.83.
In crypto, where liquidity is thinner than in equities and books on smaller exchanges can be shockingly shallow, those clusters are targets. A large player who wants to fill a long position at better prices can push price into that stop cluster, trigger a cascade of market sell orders, absorb the liquidity, and let price snap back. This is commonly called a stop hunt or liquidity sweep, and it happens on every timeframe — from the one-minute chart to the weekly.
The uncomfortable truth: your stop-loss order is visible intent. Exchanges don't publish stop levels, but price action reveals them. Every long wick that reverses within minutes is a receipt.
Round Numbers Are Where Orders Go to Die
Psychological levels — $100, $50, $0.4200 — attract both entries and stops. Market makers and algorithms know this. When price approaches a round number with a cluster of stops beneath it, the incentive to sweep is enormous: trigger the stops, buy the panic, ride the bounce.
If your stop sits exactly where everyone else's does, you've volunteered to be the exit liquidity for someone else's entry. (We've covered this pattern before from the meme-coin angle — but it applies to blue-chip BTC and ETH trades too.)
Fix #1: Size Your Stops With ATR, Not Vibes
The Average True Range (ATR) measures how far an asset typically moves in a given period. It's the single most useful number for stop placement, and it's built into every charting tool on Coinbase, Kraken, and TradingView alike.
The logic is simple: if Bitcoin's 4-hour ATR is $1,800, a $500 stop isn't a stop — it's a coin flip. You're placing an order inside the asset's normal breathing range and calling the resulting loss 'risk management.'
A practical starting framework:
- Swing trades (multi-day holds): stop 1.5 to 2x the daily ATR below your entry or below the relevant swing low.
- Intraday trades: 1.5x the 4-hour or 1-hour ATR, depending on your timeframe.
- Always check ATR trend: rising ATR means volatility is expanding; a stop that worked last month may be inside the noise now.
Then size your position backward from the stop. If your stop is 4% away and you're only willing to risk $200, your position is $5,000 — not the other way around. Stop distance is a decision; position size is the arithmetic that follows.
Fix #2: Hide Behind Structure, Not Below It
ATR tells you how far price usually travels. Structure tells you where it matters. The best stops combine both.
Look at a chart of ETH on any US-accessible exchange and find the most recent significant swing low — not the micro dip from two hours ago, but the low that, if broken, genuinely invalidates your trade idea. Then apply the ATR buffer beyond that level.
The pattern looks like this:
- Identify the swing low that matters to your thesis.
- Add a buffer of roughly 0.5 to 1x ATR below it.
- Skip the round number. If the level works out to $2,870, consider $2,838, not $2,850.
- Accept that a wider stop means a smaller position. That's the trade-off, and it's a good one.
What you're doing is placing your order outside the sweep zone — past the wick, past the round number, past where the crowd clustered. If price reaches your stop, the odds are decent that the move is real and not just a liquidity grab.
The Wick Test: A 30-Second Sanity Check
Before you place any stop, scroll back through recent price action and ask one question: how deep do the wicks typically go on this asset and timeframe?
If Bitcoin regularly prints $1,200 rejection wicks on the 4-hour chart and your stop is $600 below a support level, you've placed your order inside the wick zone. You will get tagged. It's arithmetic, not prophecy.
On smaller-cap alts, this problem is magnified. Thin books on mid-tier exchanges mean a single market sell of modest size can sweep visible stops and reverse within a candle. If you trade those pairs at all, your stops need to be even further from structure, and your positions even smaller.
The Honest Trade-Off
Wider stops mean smaller positions, and smaller positions mean smaller wins. Some traders respond by ditching stops entirely — which is how a controlled 3% loss becomes a 40% account drawdown during a weekend flash crash. That trade is never worth it.
The goal isn't to never get stopped out. It's to get stopped out only when your thesis is actually wrong — not when an algorithm needed your liquidity. Use ATR to respect the asset's normal range, use structure to find the level that matters, skip the round numbers, and size the position backward.
Do that consistently, and the wicked-out-at-the-low experience goes from a weekly ritual to a rare, acceptable cost of doing business. Your sandwiches will taste better, too.